After reading Surprising calibrate_io result by Bobby Durrett, I was wondering what results I would get for the REPOS on GRIDCTRL.
I/O Calibration
I just modified Durrett’s example by changing the number of physical disks to one (1):
SET SERVEROUTPUT ON SIZE UNLIMITED
DECLARE
l_latency PLS_INTEGER;
l_iops PLS_INTEGER;
l_mbps PLS_INTEGER;
BEGIN

DBMS_RESOURCE_MANAGER.calibrate_io (num_physical_disks => 1,
max_latency => 20,
max_iops => l_iops,
max_mbps => l_mbps,
actual_latency => l_latency);

DBMS_OUTPUT.put_line('Max IOPS = ' || l_iops);
DBMS_OUTPUT.put_line('Max MBPS = ' || l_mbps);
DBMS_OUTPUT.put_line('Latency = ' || l_latency);

END;
/
A summary of the results is:
| Run # | Max IOPS | Max MBPS | Latency |
|---|---|---|---|
| 1 | 79 | 34 | 11 |
| 2 | 104 | 35 | 18 |
| 3 | 168 | 35 | 8 |
| 4 | 164 | 34 | 8 |
| 5 | 159 | 36 | 8 |
| Min | 79.00 | 34.00 | 8.00 |
| Avg | 134.80 | 34.80 | 10.60 |
| Max | 168.00 | 36.00 | 18.00 |
There is great variation in the I/O operations per second (79 to 168) for a physical disk drive on a single database system. The same can be said for the measured latency. However, the measured MB per second appears to very consistent.
Comparison with RMAN Backups
Now, it is time to ground these measurements in reality. Since the backup of a database is very I/O intensive, the figures given by V$RMAN_BACKUP_JOB_DETAILS should correlate with the above measurements. I used the following SQL statement to generate the table below:
SELECT
rownum
AS "Run #",
input_bytes_per_sec/1024/1024
AS "Input MB/sec",
output_bytes_per_sec/1024/1024
AS "Output MB/sec",
(input_bytes_per_sec + output_bytes_per_sec)/1024/1024
AS "Total MB/sec"
FROM
V$RMAN_BACKUP_JOB_DETAILS
;
| Run # | Input MB/sec | Output MB/sec | Total MB/sec |
|---|---|---|---|
| 1 | 11.06 | 11.06 | 22.11 |
| 2 | 8.25 | 3.95 | 12.20 |
| 3 | 11.60 | 11.60 | 23.20 |
| 4 | 8.21 | 3.22 | 11.43 |
| 5 | 11.63 | 11.64 | 23.27 |
| 6 | 9.06 | 4.04 | 13.11 |
| 7 | 11.45 | 11.45 | 22.91 |
| 8 | 8.32 | 3.68 | 12.00 |
| 9 | 11.01 | 11.01 | 22.02 |
| 10 | 8.52 | 2.59 | 11.11 |
| 11 | 11.13 | 11.13 | 22.26 |
| 12 | 21.59 | 10.69 | 32.29 |
| 13 | 24.97 | 12.74 | 37.71 |
| 14 | 19.45 | 12.27 | 31.72 |
| 15 | 16.10 | 9.25 | 25.35 |
| 16 | 25.93 | 11.72 | 37.65 |
| 17 | 26.79 | 12.10 | 38.88 |
| 18 | 26.94 | 10.71 | 37.65 |
| 19 | 25.29 | 11.43 | 36.71 |
| 20 | 26.72 | 10.32 | 37.03 |
| 21 | 26.66 | 11.64 | 38.30 |
| 22 | 26.64 | 11.58 | 38.22 |
| 23 | 27.30 | 10.43 | 37.72 |
| 24 | 26.51 | 11.57 | 38.08 |
| 25 | 26.91 | 10.31 | 37.21 |
| 26 | 25.39 | 12.15 | 37.53 |
| 27 | 25.61 | 12.25 | 37.86 |
| 28 | 24.47 | 11.72 | 36.19 |
| 29 | 25.73 | 11.22 | 36.95 |
| 30 | 12.43 | 5.39 | 17.82 |
| 31 | 20.02 | 8.76 | 28.78 |
| 32 | 12.04 | 6.30 | 18.33 |
| 33 | 23.83 | 12.44 | 36.27 |
| 34 | 25.06 | 12.39 | 37.46 |
| Min | 8.21 | 2.59 | 11.11 |
| Avg | 19.19 | 9.85 | 29.04 |
| Max | 27.30 | 12.74 | 38.88 |
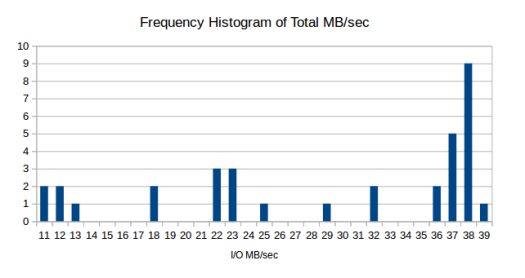
The maximum of the Total MB/sec is greater than the value calculated by the I/O calibrate routine. The range of values obtained from a RMAN value is best described by a frequency histogram:
As can be seen, this is a very skewed distribution showing that over half of the measured RMAN values greater than that calculated by the I/O calibration process.
Summary
The DBMS_RESOURCE_MANAGER.CALIBRATE_IO routine can give a spread of results on even a very simple system of a single database with a single physical disk.
An alternative measure seems to be available through the V$RMAN_BACKUP_JOB_DETAILS view that records the I/O activity of RMAN backups. This view gives historical of actual rates achieved but only for MB/sec. Latency and I/O Operations per second are not available.
The best approach could be to use a combination of these measures to get a rough idea of the ability of the I/O subsystem.
